Elliot Wave Theory: A Raw Dive into Nature’s Law Ep 3
Introduction
What if I told you that stock markets don’t move randomly? That behind every bullish breakout or bearish collapse lies a deeper natural rhythm, just like the tides, moon phases, or sunflower spirals? This is exactly what R.N. Elliott set out to prove through his groundbreaking work — the Elliot Wave Theory.
Let’s go on a journey that touches not just charts and numbers but also philosophy, geometry, nature, and human emotion.
What Is Elliot Wave Theory?
The Elliot Wave Theory proposes that market prices move in predictable, natural patterns or “waves.” These are not just random swings; they follow laws deeply rooted in human psychology and nature itself.
Elliott believed that crowd behavior — the emotions of fear and greed — creates repeating cycles, just like waves in the ocean.
Check out our previous episode here. EP2
The Core Philosophy: Nature’s Law
Elliott’s work wasn’t just a market theory — it was a universal law.
He believed:
- The universe operates under natural laws, not chaos.
- Human actions — like buying or selling — are part of that universal law.
- If we observe closely, we’ll find repetition, harmony, and rhythm, just as we do in architecture, music, or even comets returning to the Earth.
Real-World Examples of Natural Law
- Halley’s Comet was first observed in 1682 and correctly predicted to return in 1759.
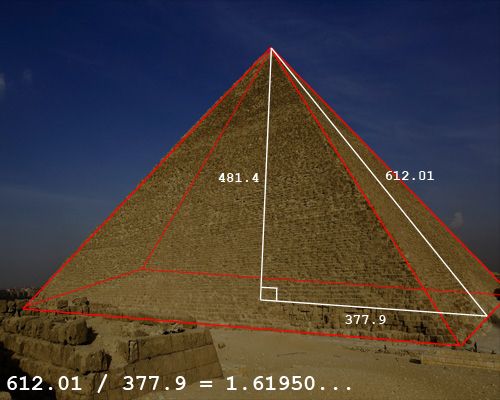
- Pyramids of Giza — their base-to-height ratio is exactly 0.618, the golden ratio. 5 surfaces, 8 lines.
- Sunflowers, shell spirals, and even human DNA — all express this hidden mathematics of Fibonacci sequences.
So, why not stock markets?
The Market: A Mirror of Human Nature
According to Elliott:
“Man is not unlike a natural object. The action, reaction, all of them can be predicted or at least will reoccur because participants change, but the nature of man does not change.”
Hence, the stock market — where emotion rules — becomes the perfect subject for observing natural law in action.
The 1929 Crash: The Turning Point
The devastating 1929 stock market crash was a wake-up call. While everyone else saw chaos, Elliott saw structure. He observed:
- Prices appeared random, but zoomed out — they moved in rhythmic, repetitive waves.
- There was a method to the madness.
- If you could identify the wave pattern, you could forecast major tops and bottoms.
The 5 Critical Conditions for Wave Analysis
For Elliot Wave Theory to be applicable, Elliott defined five conditions that must be met:
- Extensive commercial activity via widely distributed corporate ownership.
- A proper marketplace where prices are transparently recorded.
- Reliable, honest data (to avoid scams and manipulations).
- Comprehensive statistics on companies (expenses, sales, market turnover).
- Availability of OHLC data (Open, High, Low, Close) for multiple degrees of analysis.
Fibonacci Sequence: The Heart of the Wave Theory
The Elliot Wave Theory deeply relies on the Fibonacci sequence:
1, 2, 3, 5, 8, 13, 21, 34, 55, 89…
Why is this important?
- The ratio of successive Fibonacci numbers (e.g., 5 ÷ 8 or 34 ÷ 55) approaches 0.618, or 61.8% — the Golden Ratio.
- Inversely, we get 1.618 — the Phi Ratio — a constant in spirals, nature, and now, market movement.
Elliott believed these numbers held the key to predicting market waves.
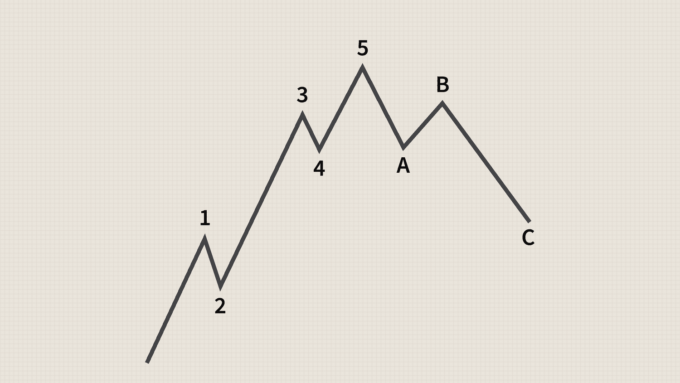
Waves in Markets: Structure and Sequence
The Major Conclusion by Elliott
Markets move in waves, and these waves follow Fibonacci numbers.
He identified three degrees of wave counts:
| Wave Degree | Bull Market | Bear Market | Total Waves |
|---|---|---|---|
| Major | 5 | 3 | 8 |
| Intermediate | 21 | 13 | 34 |
| Minor | 89 | 55 | 144 |
✅ A full cycle (bull + bear) never exceeds 144 waves.
This aligns with the maximum number of seed spirals in a sunflower — 144 — completing the circle of nature.
Why 144 Is Important
- It is the culmination of a full cycle.
- After 144 waves, a new pattern begins.
- It reflects the ultimate limit of market movement in one full rhythm.
Final Thoughts: Elliot Wave Theory Is More Than Just Trading
The Elliot Wave Theory is not just a tool for traders. It’s a lens to view the order in chaos, the mathematical truth in emotions, and the cosmic dance of fear and greed.
You’re not just reading waves on a chart.
You’re observing the pulse of the universe through market prices.
Key Takeaways
- Markets are not random — they move in natural, predictable wave patterns.
- These patterns follow Fibonacci sequences — numbers found throughout nature.
- Elliot Wave Theory uses wave counts to predict the start and end of bull/bear markets.
- A complete cycle never exceeds 144 waves.
- Behind price is human emotion, and behind emotion is natural law.
Start Your Wave Journey
This is just the beginning.
We’ll soon explore how to label Elliot Waves, identify wave degrees, and apply this theory to real charts.
So stay tuned.
And remember:
The market is not chaos.
It’s poetry, geometry, psychology — all in motion.
Want to learn more about Elliot Wave Theory?
Subscribe, share your questions below, and follow the next episode.
Check out youtube here