

Elliot Wave Tutorial: Master the 5-3 Wave Structure Ep 3.3
Introduction to Elliot Wave
The Elliot wave helps traders spot market trends. This Elliot Wave tutorial explains the 5-wave impulse and 3-wave correction. You will learn to read market turns. Apply this method to improve your trade timing and risk control.
Last Blog:-https://taptradinghub.com/elliott-wave-theory-rules-impulse-waves-and-corrections-ep-3-2/
Last Video:- https://studio.youtube.com/video/GA6cmRQKbnc/edit
1. Understanding the Structure
1.1 What Is the Elliot Wave?
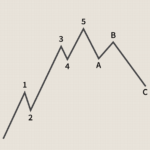
The Elliot wave idea was made by Ralph Nelson Elliott. It shows how group emotion moves prices in repeat patterns. One cycle has two parts:
- Five waves up (1–5)
- Three waves down (A–B–C)
1.2 Impulse vs. Corrective Waves
- Impulse waves (1, 3, 5) move with the main trend. Each has five small waves inside.
- Corrective waves (2, 4) move against the trend. They form simple ABC patterns.
2. Key Elements of an Elliot Wave Tutorial
2.1 Wave 3: The Strongest Move
Wave 3 in the Elliot wave cycle is the largest and fastest. It often goes beyond common Fibonacci targets.
2.2 Wave 4: The Sideways Correction
Wave 4 usually moves sideways in a triangle. Wait for a clear break before entering trades.
2.3 Wave A-B-C: The Pullback
After the five-wave impulse, prices pull back in three waves:
- A: The first drop. Many think the trend has reversed.
- B: A small bounce back.
- C: The final leg down.
3. Real-World Examples
3.1 COVID-19 Market Swing (Nifty 50)
In March–April 2020, Nifty 50 showed a clear Elliot wave pattern:
- Wave 1: Panic sell-off
- Wave 2: Quick rebound
- Wave 3: Strong rally
- Wave 4: Sideways triangle
- Wave 5: Final surge
3.2 Reliance Industries Monthly Chart
Reliance’s long-term chart also fits the rules:
- Wave 1–2: Rise then pullback
- Wave 3: Big climb
- Wave 4: Extended correction
- Wave 5: Last push up
3.3 Bank Nifty Complex Corrections
Bank Nifty often shows W–X–Y or W–X–Y–X–Z patterns. These are advanced Elliot wave corrections in volatile phases.
4. Simple Trading Tips
- Use Multiple Timeframes: Check wave counts on monthly, daily, and intraday charts.
- Add Fibonacci Levels: Use 38.2%–61.8% retracements for Wave 2 and Wave B.
- Set Clear Stops: Place stops past Wave 1 start or Wave B end.
- Trade Wave 3: Target the strongest wave for best returns.
5. Further Reading & Resources
- Youtube: Elliott Wave Theory (outbound link)
- Telegram (outbound link)
- Our Blog: Advanced Wave Patterns (internal link)
- Our Courses: Technical Analysis Foundations (internal link)
Conclusion
This Elliot wave tutorial gives you the basics: five-wave impulses and three-wave corrections. You saw real charts and simple tips. Use these rules with solid risk control. Ready for more? Check Chapter 2 on advanced corrections and Fibonacci targets. You can watch video below or clicking here
Ask your questions in the comments or visit our forum to discuss with other traders!

Comments are closed.